A primer for the U.S. Census American Community Survey data
The U.S. Census records such an incredible, intimidating volume of data points about American life that is is hard to know where to begin. This guide aims to explain how Census data is organized, how to find important and interesting data points, and how the data is distilled and displayed by journalism outlets.
Note: these quick links are elaborated further into this article. These are here just in case you need to get right to the URLs:
Selected demographic data from the 2015 ACS 1-Year-Data for U.S. states, Congressional Districts, and places:
Learning SQL and other data skills with simplified U.S. Census data
The U.S. Census data is incredibly useful for data exploration: it's free, it's plentiful, it's so detailed that the avenues for analysis are virtually limitless – and the core concept: counting people, is of vital importance to the foundation of American democracy.
But, as with anything interesting and profound, understanding Census data is complicated. So, for the purposes of tutorials and examples, I've created a slice of U.S. Census data – specifically, population counts per state, Congressional district, and Census-defined place – from the recent 2015 American Community Survey 1-Year-Data.
That the previous sentence is a mouthful is a reflection of at how multi-faceted and confusing the Census data can be.
So the rest of this this article, besides including links to the downloadable data, is a gentle walkthrough of what the U.S. Census data includes, what is immediately interesting about it, and how to explore it efficiently on your own.
Downloading the sample ACS data
Here are the quick links to the data; I'll refer to them in the relevant tutorials so need to bookmark them:
Selected demographic data from the 2015 ACS 1-Year-Data for U.S. states, Congressional Districts, and places:
- Google Sheets – for easy for web browsing. Or you can export to an Excel spreadsheet and download it.
- SQLite database - the same data, but imported into a SQLite database file. Just click to download the file, then open the file the SQLite client of your choice.
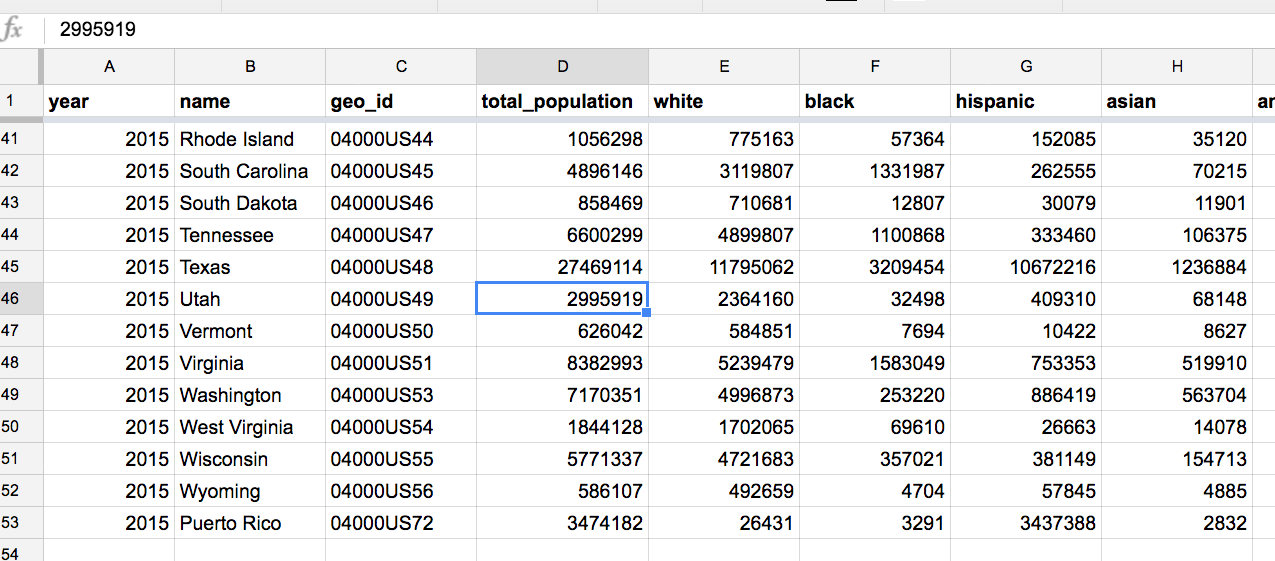
Here's a screenshot of the spreadsheet, to give a preview of what this data's scope:
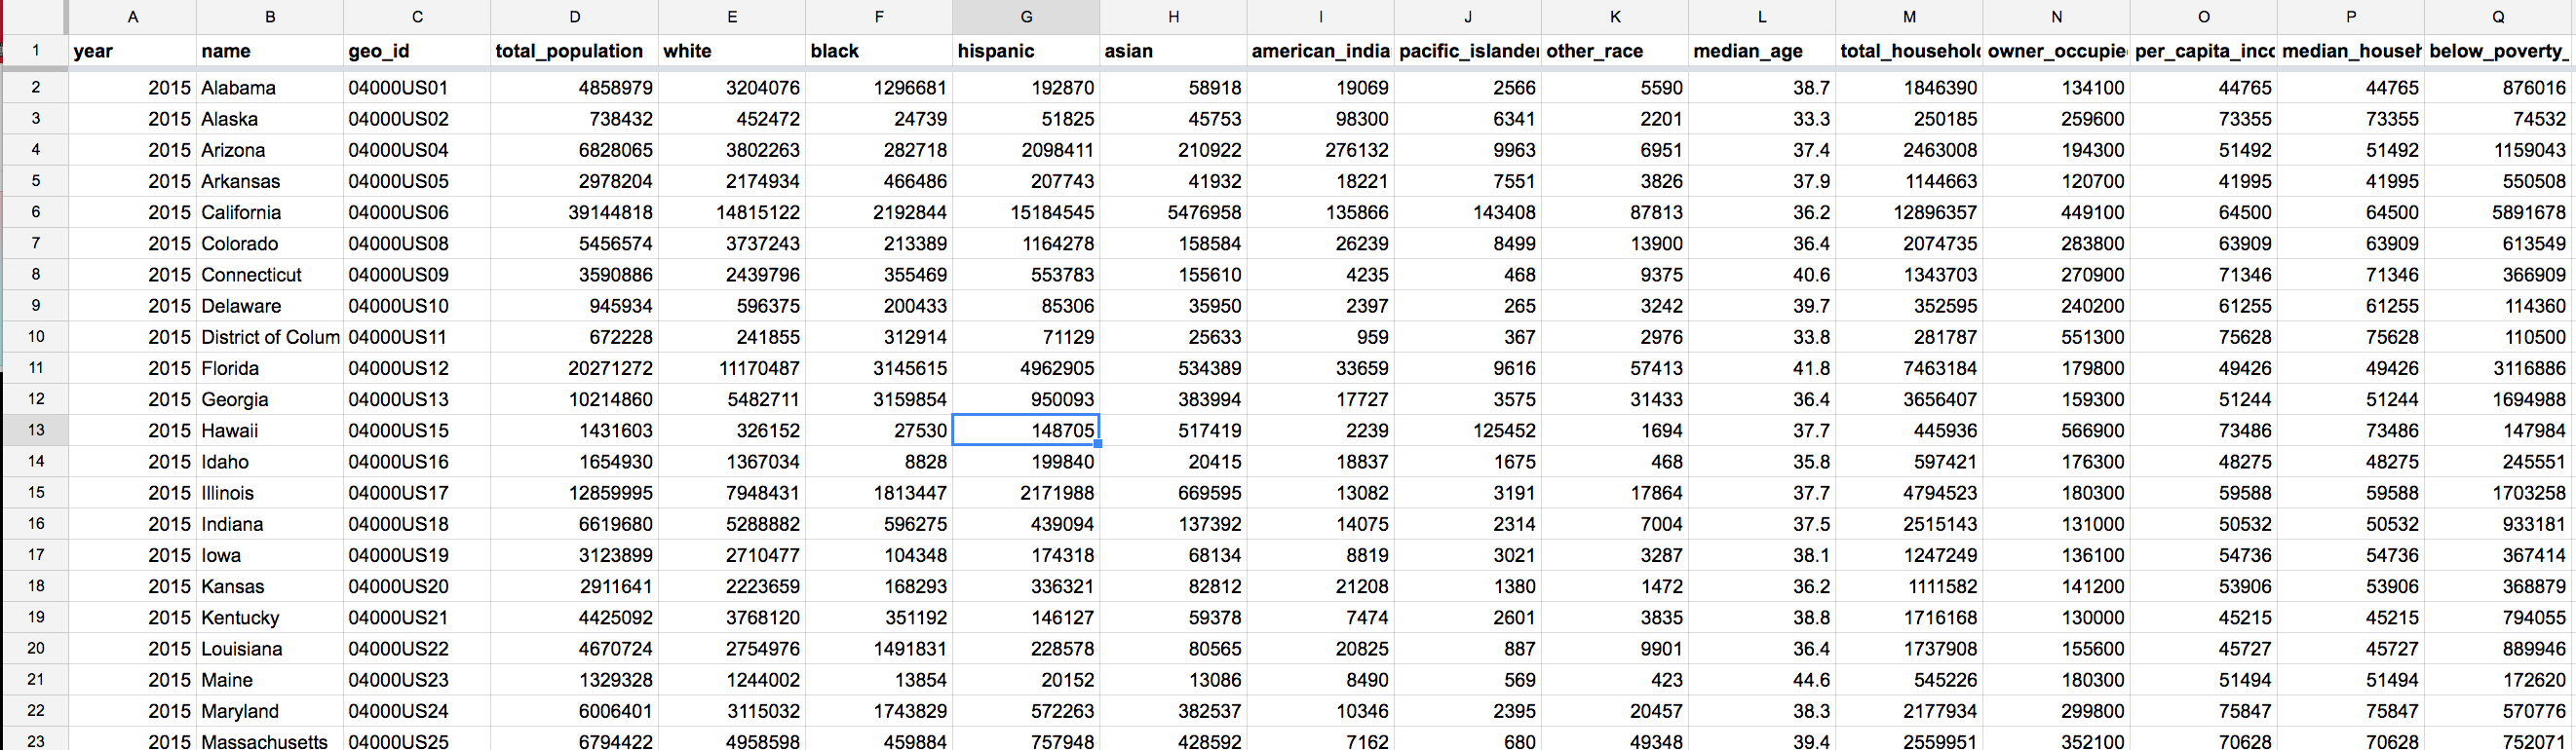
The spreadsheet contains 3 tables: states, congressional districts, and Census-defined "places". Each table has the same columns, just counted for the different geographies, e.g. Use the states tab to get the below_poverty population count for the state of Texas, the congressional-district tab to get that datapoint for the 12th House District in Florida, and the places tab to get that number for the "place" of the city of Mountain View, California.
Naming is hard
The SQLite database contains 3 tables, just as the spreadsheet contains 3 sheets. Due to some carelessness and laziness on my part, because I did the conversion by hand: I manually renamed the SQLite table names to follow I like things in my databases (the names of spreadsheet tabs is generally of less consequence)
| SQLite table name | Google Sheet tab name |
|---|---|
| states | state |
| congressional_districts | congressional-district |
| places | place |
This really has no effect on anything, really. You can mess around with the spreadsheet on your own, it's not as if anything you do can be directly applies, as SQL code, the the SQLite tables. And vice versa. I just wanted to make clear how arbitrary the specific names and conventions for data can be. Not just in this database, but virtually every other database and spreadsheet of import – think, old government computers.
Exploring Census data with CensusReporter
Need a quick, elegant way to get up to speed on the value and potential of the Census data. Visit CensusReporter and look up a neighborhood you know.
Below is a screenshot showing some of the data panels for the Census-tracked geography of zipcode 10013 (SoHo in New York); The data on age, and median outcome, and public-transit usage fits a few assumptions I have about this Manhattan neighborhood:
I can't praise enough the Knight Foundation-funded CensusReporter, hosted at censusreporter.org for making understandable, and useful, the insanely complex Census data. Seeing which data points CR chose to include in its beautiful layout was invaluable for filtering for the most useful dozen data points out of the several thousand collected. When I'm unsure if I've interpreted a Census data point, CR is a fantastic site for quickly double checking.
So it's fitting to use CensusReporter as a way to show the Census data and data structure.
Counts by geography
The Census tabulates numbers for all kinds of geographies: from the entire U.S., to states, and their individual counties. To as small and specific as local school district and city blocks.
Census data for the entire U.S.
Let's start out easy by finding numbers for the U.S. as a whole. It's easy to Google for Census numbers of the entire U.S., which brought me to the QuickFacts page for the entire U.S. of A:
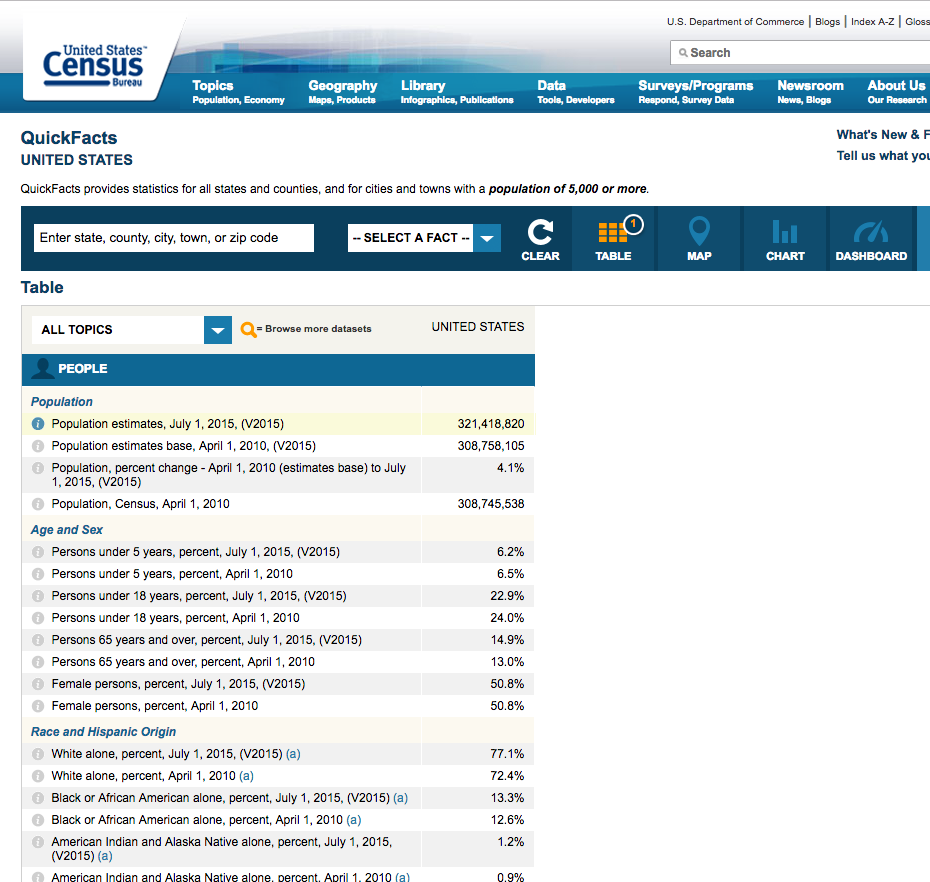
No big surprises: the U.S. population is estimated to be 321,418,620, as of July 2016.
The Census does have top-line numbers for the entirety of the United States: Checkout the QuickFacts page for the "country" geography of the U.S., which includes a July 2016 estimate of the U.S. population at 321,418,820.
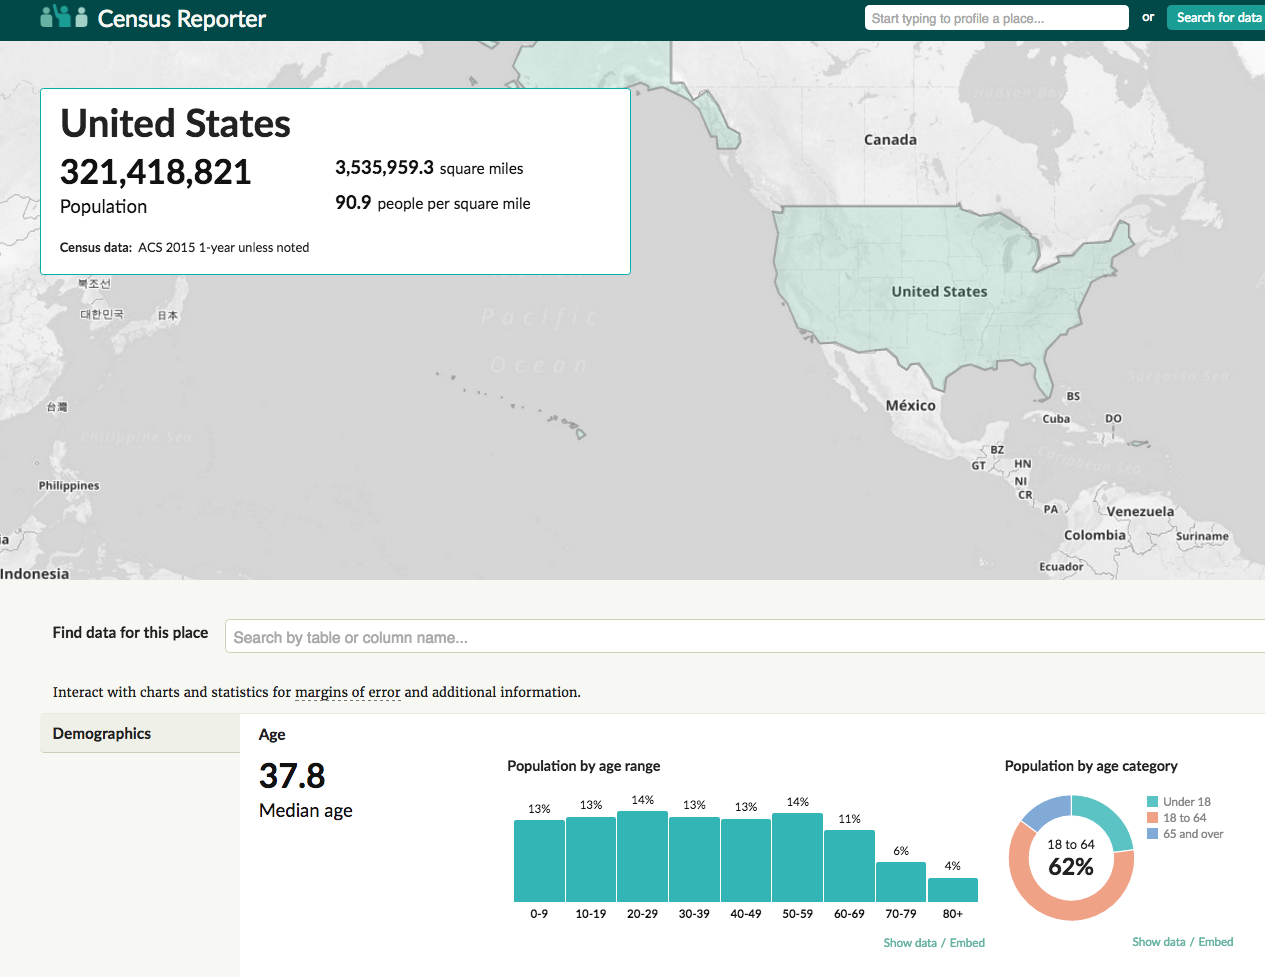
Typing in "United States" into the search box for Census Reporter takes us to the CR page devoted to the U.S. And we see the similar top-line numbers:
Census data at state level, for California
"Big" data, or rather, big data points, are too general to be interesting – does it matter that America's median age is 37.8. It would be a little more interesting, if we could compare America's median age and other stats to other countries.
But The U.S. Census Bureau only counts the United States, there isn't a global Census.
So we go smaller: The Census actually has region-sized units, e.g. Northwest, Southwest, etc. But those are also boring, so we look at Census data by state:
Here's the CR page for California:
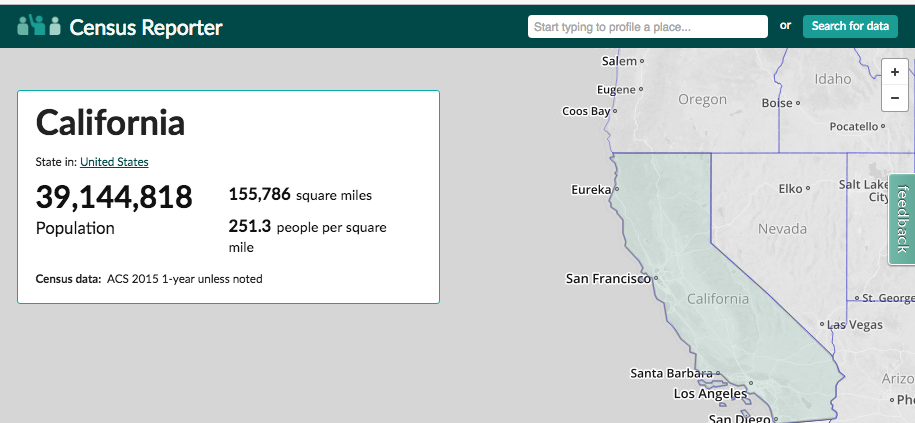
Scroll past the map/overview view to see demographic data: California, overall, is 38% white, versus 61% average for the entire U.S.
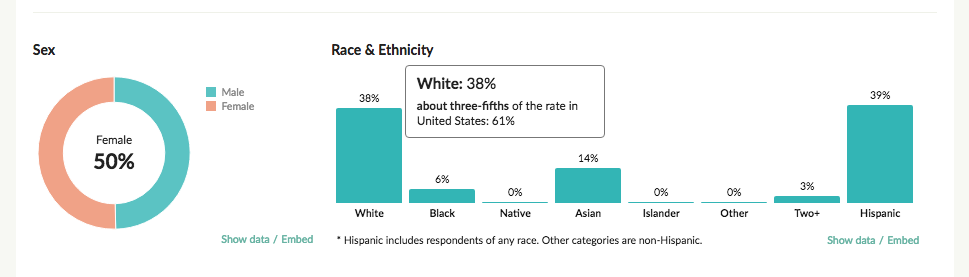
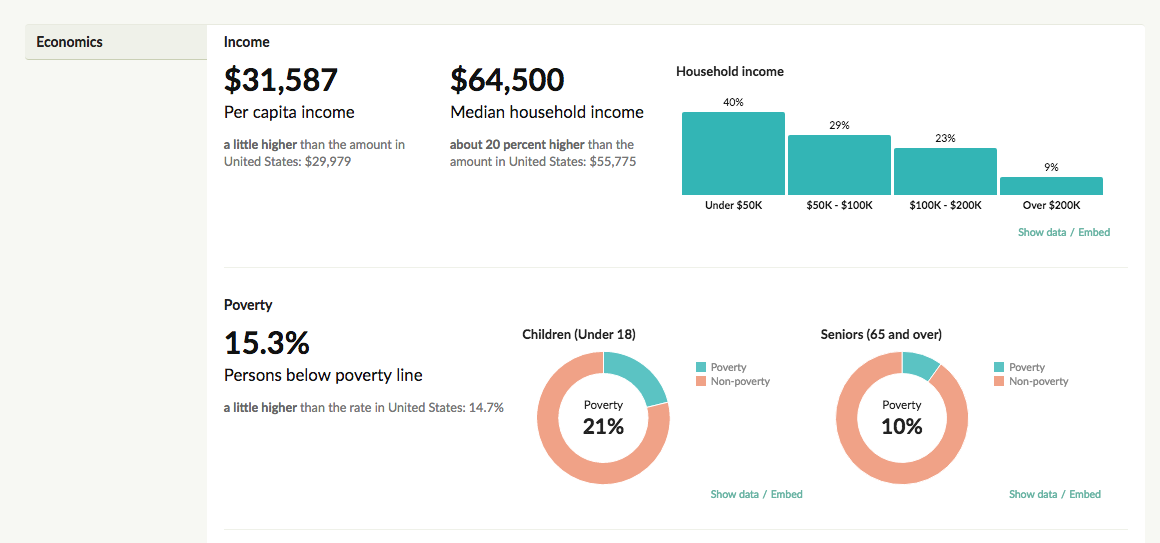
In terms of wealth metrics, the state of California has 15.3% of its population below the poverty line, compared to 14.7% for America overall. But the median California household income is $64,500, about 20 percent higher than the U.S. average if $55,755.
Profiling California U.S. House District 17
One way to examine California as smaller pieces it to look at data by county, e.g. Santa Clara County. But, for the sake of brevity, let's use the geographies included in the aforementioned sample ACS data set.
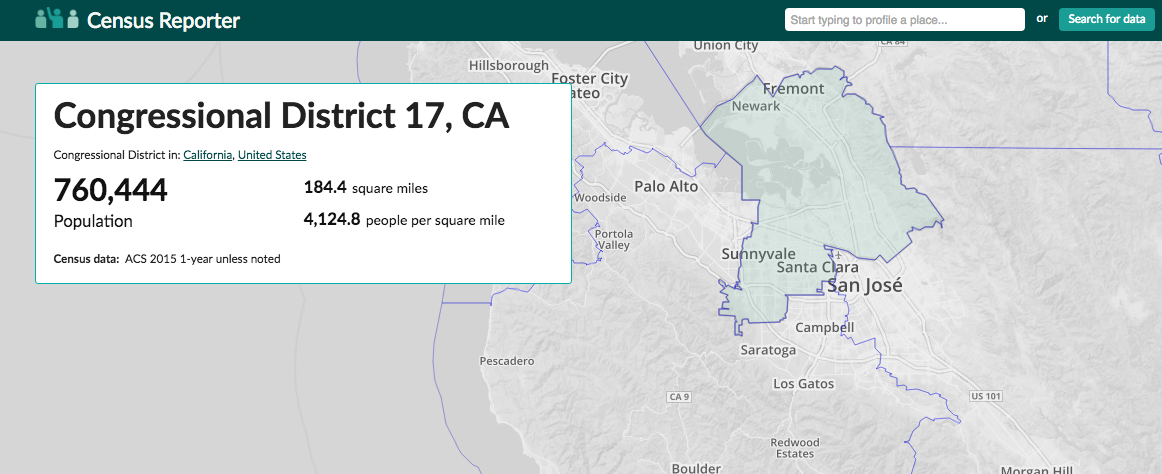
California is divided up into multiple areas for U.S. House seats, i.e. congressional districts.
Here's the CensusReporter page for District 17:
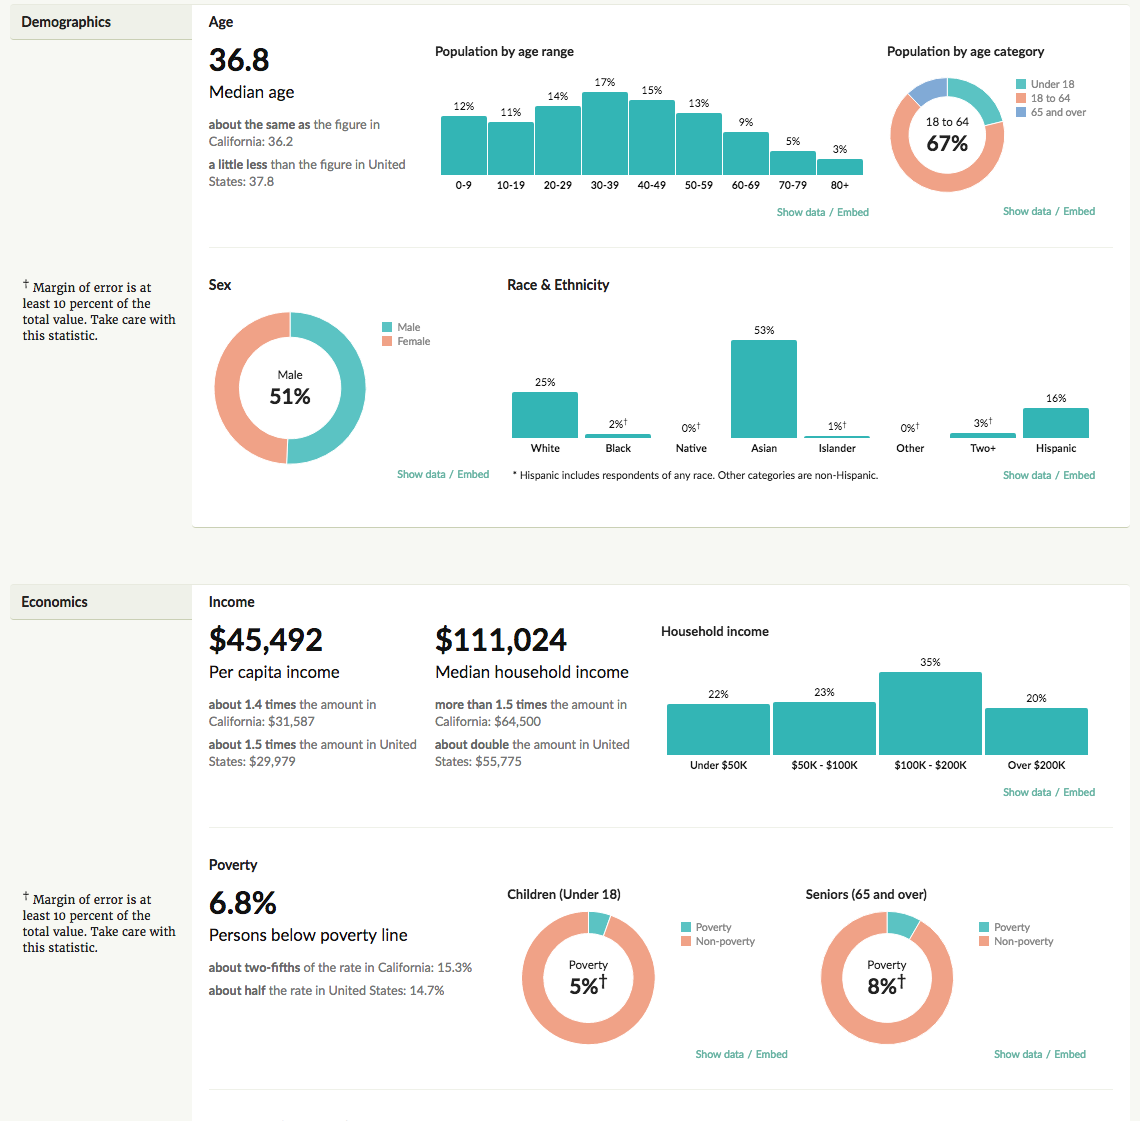
As it turns out, CA District 17 is one of the most competitive House races in 2016. Both candidates happen to be of Asian descent, and so does 67 percent of the folks counted by the U.S. citizen:
And how wealthy is the median household for the Congressional District that contains much of Silicon Valley? The median household income is $111,024 – about 1.5 times the median California state household income:
Double-checking the sample data
We could keep going smaller, comparing the data, city against city, or even neighborhoods versus neighborhoods (as approximated by the Census geographical units of tracts and blocks).
We could thinking about comparing the many other data points. In the sample dataset, I've chosen to keep things simple. The data columns pertain to numbers by ethnic/racial group and income metrics. Obvious metrics, but they're easy to understand, and of great relevant in the current climate and upcoming election.
Before we finish up with exploring CensusReporter, let's make sure its numbers match up with my spreadsheet.
For the state of Utah, CensusReporter lists its population as: 2,995,919
I have the same value in the total_population column in my spreadsheet:
Keeping on the state of Utah, CensusReporter has a chart in which Utah's population is listed as 14% Hispanic:
As it turns out, the U.S. Census does not provide its data as percentages or ratios. In the hispanic column for the state of Utah, I have a value of 409310 – presumably the absolute count of Hispanics:
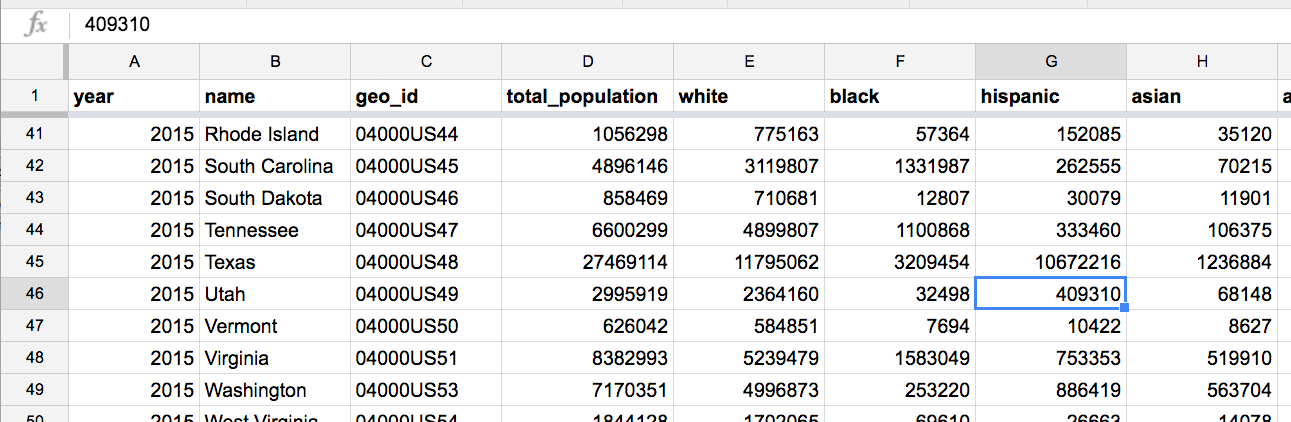
To get the CensusReporter's 14%, we just have to do some math. We could derive a new column in the spreadsheet named hispanic_pct, which would be this formula:
100.0 * hispanic / total_population
But we just want to double-check our datapoints for Utah:
100.0 * 409310 / 2995919 = 13.662
13.662 rounded up is 14%, which corresponds to the number that CensusReporter has for Utah.
I walked through the arithmetic above in detail, not to waste our time practicing math, but to draw attention to how an interesting data point – percentage of total population that is Hispanic – is not actually in the original data. We have to calculate that ourselves. Hopefully, by now, that is routine in spreadsheets. And you'll see that it is just as routine in SQL.
Some background about the Census and ACS data
Not sure why I wrote the following wall-of-text. If you've read up to here, you're familiar enough with the data to use it in the subsequent data tutorials.
But I hate deleting all that work; read at your leisure, especially if, in the near future, you see a need to fetch and wrangle your own copy of the Census data:
Counting is part of the Constitution
The U.S. Constitution, a document famous for having some feelings about how to enumerate and protect the rights and representation of American citizens, includes a section directing Congress to do count the population every 10 years. Besides being a statistical benchmark for America's size and wealth, the population count is how we decide other important numbers, such as how many seats each state gets in the U.S. House.
Counting America is a task enormous enough that 10 years is alloted for the task. The U.S. Census Bureau was established in 1942 and has a staff numbering more than 4,200. With that kind of time and manpower, the Bureau is able to track more than just numbers of citizens, but the number of citizens by age group, gender, ethnic background, median income, and population counts and characteristics grouped by households – because America has many types of households that aren't the traditional owner-occupied by a nuclear family.
The categories can be as specific as how many college-educated – or high-school dropouts – millennials live with their parents, by ethnic background, compared to millennials who are married, or who live with "just friends.".
The American Community Survey
The American Community Survey, or ACS for short, is the Census survey/data-release that contains the data most useful to journalists and policy officals. As this Census webpage describes it, the ACS is "the premier source for detailed information about the American people and workforce."
The ACS Data, 1-Year vs 5-Year
The Census Bureau is always counting, estimating, and releasing, not just when the start of a decade nears. The ACS itself comes in several packages, based how many years of data – 1 versus 5 years – are used in making estimates.
Is the year currently 2016, and do you need the Census's most recent counts and estimates for the population of entire U.S. states? Then you want the 1-year 2015 data release, which has the population estimates based on 12-months of collected data. Looking for estimates for U.S. counties that my have as few as 10,000 folks? The Bureau's estimates based on 12-month-data aren't accurate enough. So you have to wait a little longer for the 5-year estimate, which is based on data from 2011 to the end of 2015. Or use the 5-year-data from 2014, which includes counts from 2010 to 2014.
As if the number of categories the Census track weren't confusing enough, they offer datasets of the same kinds of data, and choosing between them depends on how much we value having the most recent estimates versus the most accurate estimates. That won't mean much for our SQL lessons, but it's something to keep in mind when trying to use Census ACS data for real stories.
Where to get the data on your own
So many choices, and all so confusing. The data encompassed by the ACS is so wide and voluminous, packaged in a variety of ways and locations, that I don't have a single, easy recommendation. But here's a few links you can try once you get tired of using my data:
- The American FactFinder is the official Census site with an ostensible user-friendly web-form for choosing data and downloading it as data files. Off the top of my head, I have no idea how to use it, or even where to start. Though most students are able to click their way through it.
- The Census API: If you have some programming skill, the API can be used for quickly downloading data. But you still need to familiarize yourself with what the Census data contains, even before figuring out how the API works.
- The FTP site: for the old school types, with really fast Internet connections and huge hard drives, you can download all of the data in bulk. Extracting the useful parts requires – you guessed – studying the Census documentation about its data schemas.