Homework: Basic Spreadsheet and Pivot Table Exercise with Evictions Data
A little warmup of how to use functions and pivot tables in Google Sheets, and an introduction to evictions data.
-
In your padjo-2016 folder, a Google spreadsheet named:
sf-evictions-basic-pivots -
The
sf-evictions-basic-pivotsspreadsheet should have one line chart (make it a separate tab) which shows the number of evictions per filing year per supervisor district.
-
Tinker around with the Google Sheet Chart wizard settings to label both the x- and -y axes, and give a title to the graph. Nothing fancy needed.
Follow this tutorial using SF Crime Data. It covers how to do basic pivot tables in Google Sheets, e.g. the overall goal, and all the clicking to get there.
Then, repeat the concepts using a different data set: Eviction Notices via SF Open Data.
Here's a direct link to download the data as CSV.
Import it into a Google Sheet. Then make this visualization: A line chart showing the number of evictions per filing year per supervisor district. Yeah, it'll be pretty messy. In fact, it'll look like this:
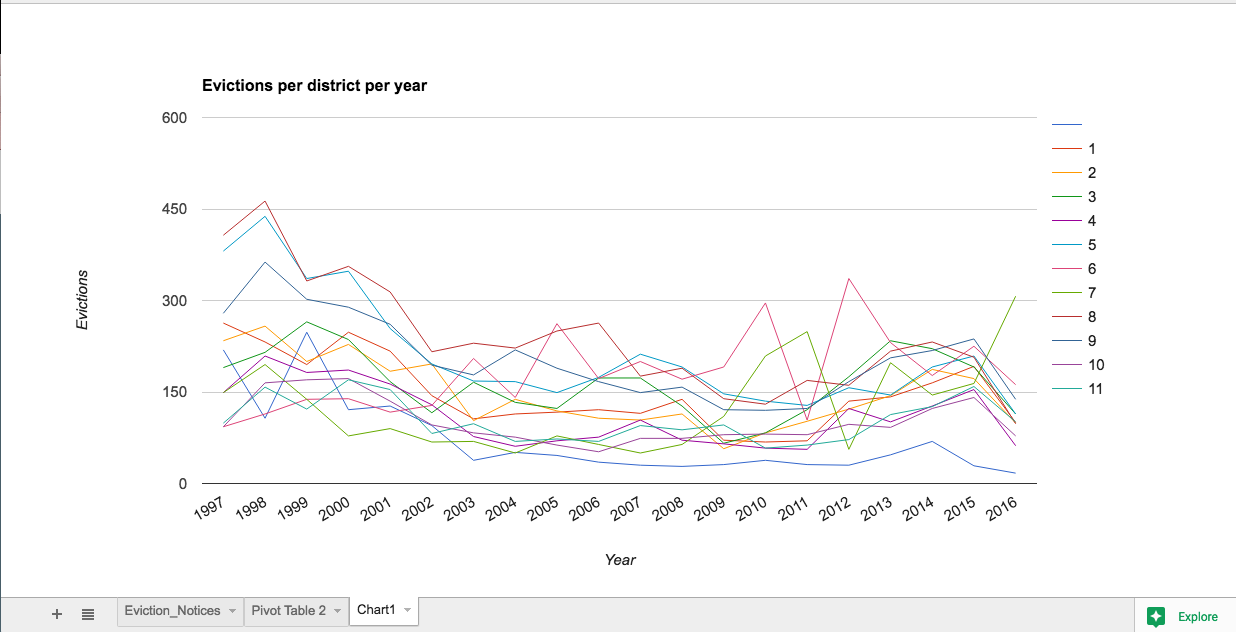
Add titles/labels to the chart to provide just a smidgen of order, and to get a feel for how Google's chart editor works.
To create this chart, you'll need to make at least one pivot table. And before that, you'll need to wrangle the imported data so that there's a year value to pivot on.
Warning 1: You would think that the YEAR function is exactly what you need. But it might not work for you (it didn't for me). So think of an even more direct and literal way to extract the year value from the File Date column.
Check out the Google spreadsheets function list for all the possible ways to transform/extract values from a data cell.
Warning 2: Because the dataset is pretty large, when you create the pivot table, it may take a couple of minutes and it will seem as if your browser has hung. You could make things quicker by just deleting the unnecessary columns.
Related reading
Here's a few evictions-related data stories from our very own Stanford alumni and Peninsula Press:
-
Tenants in San Francisco's Mission, Sunset neighborhoods get most eviction notices
-
Mountain View residents push for historically elusive rent control - Peninsula Press - note: this doesn't use an evictions dataset from Mountain View, but maybe someone should try asking Mountain View for their eviction data…
-
How many eviction notices near you? - note how the author limits the data to 2011-and-after. When you make the chart for this homework, you'll see how messy including every year of data is. So sometimes you have to make a choice about what is most relevant.