Homework: Aggregation SQL warmups with earthquakes
Just some exercises covering SQL up to GROUP BY, and to familiarize you with earthquake data.
-
Email me at dun@stanford.edu
-
For all questions, email me the queries
-
For queries 1 through 5, the result of your query should result exactly in the given answer.
-
For question 6, export the result into a sheet in
sql-agg-quakes. Then make a time-series chart (just a bar chart, basically) showing number of quakes per year-month. -
For question 7, export the result into another sheet in
sql-agg-quakes. Then make a histogram (just a bar chart, basically) and make a time-series chart showing number of quakes per year-month. -
For question 8, it’s basically 6 and 7 together, but use a pivot table to create a table in which year-months are the column heads, and magnitude are the rows. Then visualize
-
Create a new spreadsheet named
sql-agg-quakes -
Download the 1995 through 2015 SQLite quakes database.
This is a set of aggregate exercises, to get familiar with earthquakes and comfortable with aggregation. With GROUP BY, we are able to analyze 16000+ earthquake events and get a summary picture (final question):
For more help: A quick gist with sample queries for the quakes database
Questions
1. The 5 biggest earthquakes, ordered by magnitude, in 2015
Include only these fields: id, time, mag, place
Hint: you don't need any grouping/aggregation. This is straight up select and sort.
The results:
| id | time | mag | place |
|---|---|---|---|
| ci14607652 | 2010-04-04 22:40:42.360000 | 7.2 | 12km SW of Delta, B.C., MX |
| ci9108652 | 1999-10-16 09:46:44.460000 | 7.1 | 16km SW of Ludlow, CA |
| usp000jhr6 | 2012-04-12 07:15:48.500000 | 7.0 | Baja California, Mexico |
| usp000gzyb | 2009-08-03 17:59:56.170000 | 6.9 | Sonora, Mexico |
| uw10530748 | 2001-02-28 18:54:32.830000 | 6.8 | Puget Sound region, Washington |
The answer
SELECT id, time, mag, place
FROM quakes
where SUBSTR(time, 1, 4) = '2015'
ORDER BY mag DESC
LIMIT 5;
2. For 2011 and 2015, the count of earthquakes and the biggest magnitude
Include only 3 columns, the year, the count, and the max magnitude.
You'll need to GROUP BY.
Hint: Use the STRFTIME function to extract the year value from the time column: STRFTIME('%Y', time)
Hint: STRFTIME might be treated as a string, so you might have to do: year='2011'
You could use SUBSTR, but it's better to practice STRFTIME.
The expected result:
| year | quakecount | maxmag |
|---|---|---|
| 2011 | 799 | 6.0 |
| 2015 | 1696 | 6.7 |
The answer query
SELECT STRFTIME('%Y', time) AS year,
  COUNT(*) AS quakecount,
  MAX(mag) AS maxmag
FROM quakes
WHERE year IN ('2011', '2015')
GROUP BY year;
3. For every year in the database, get the count and max magnitude for each quake.
Just like #2, but no WHERE clause. Same kind of GROUP BY. Pretty much the same query, but simpler, because we aren't filtering out years.
The expected result:
| year | quakecount | maxmag |
|---|---|---|
| 1995 | 657 | 6.6 |
| 1996 | 572 | 5.8 |
| 1997 | 618 | 5.7 |
| 1998 | 649 | 5.4 |
| 1999 | 1249 | 7.1 |
| 2000 | 559 | 5.6 |
| 2001 | 612 | 6.8 |
| 2002 | 585 | 5.7 |
| 2003 | 593 | 6.48 |
| 2004 | 851 | 6.0 |
| 2005 | 554 | 5.6 |
| 2006 | 529 | 6.6 |
| 2007 | 460 | 6.1 |
| 2008 | 604 | 6.2 |
| 2009 | 537 | 6.9 |
| 2010 | 2053 | 7.2 |
| 2011 | 799 | 6.0 |
| 2012 | 580 | 7.0 |
| 2013 | 724 | 6.6 |
| 2014 | 1460 | 6.02 |
| 2015 | 1696 | 6.7 |
The answer
SELECT STRFTIME('%Y', time) AS year,
  COUNT(*) AS quakecount,
  MAX(mag) AS maxmag
FROM quakes
GROUP BY year;
4. Find Oklahoma's 10 largest earthquakes in 2009
Select just the id, time, place, and mag columns.
If you've looked at the data, you should have noticed that there is no state field. So there is no build in way to group by state name. The place column doesn't work, because it's just a general human descriptor, like "22M W of San Francisco".
So we'll do something manual to limit rows to Oklahoma: filter by latitude and longitude.
The first step is to go to http://boundingbox.klokantech.com/, a site for drawing bounding boxes.
Then, draw a box around Oklahoma's boundaries: it won't be perfect, and yet, it will be annoying:
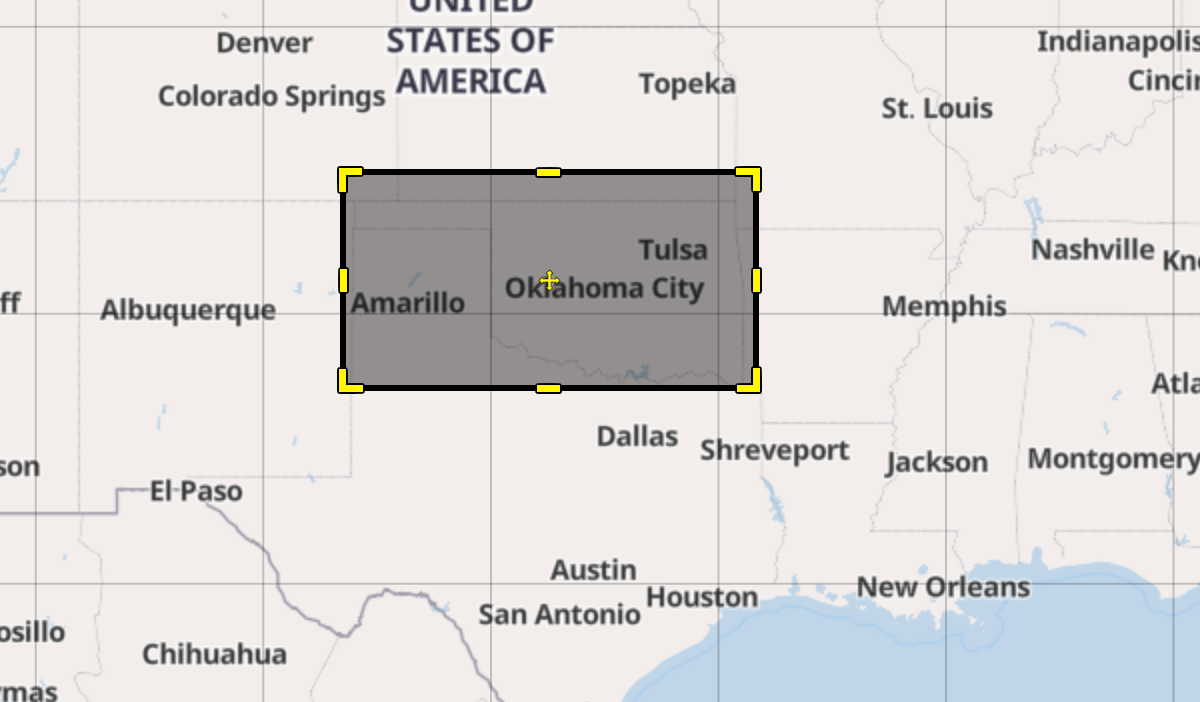
At the bottom of the screen, you'll see a Copy and Paste bar – this is where your coordinates are. If I were you, I'd change the selection to CSV. You'll get 4 decimal numbers, separated by commas.
Something like:
-103.25,33.65,-94.17,37.51
The first two coordinates represent the longitude and latitude for the top left corner of the box. The other two are the bottom-right corner of the box.
Your WHERE query, when it comes to filtering by latitude and longitude, will look something like:
WHERE (latitude > 10.1 AND latitude < 20.1) AND
  (longitude > -100.1 AND longitude < -98.1)
Your answer might differ from mine depending on your boundaries.
The result:
SELECT id, time, place, mag
FROM quakes
WHERE (latitude > 33.65 AND latitude < 37.51 ) AND
  (longitude > -103.25 AND longitude < -94.17) AND
  substr(time, 1, 4) = '2009'
ORDER BY mag DESC
LIMIT 10;
| id | time | place | mag |
|---|---|---|---|
| usp000gyn5 | 2009-06-26 21:23:13.750000 | Oklahoma | 3.7 |
| usp000h506 | 2009-12-13 08:38:25.880000 | Oklahoma | 3.6 |
| usp000h4ur | 2009-12-07 17:44:25.180000 | Oklahoma | 3.5 |
| usp000h0y9 | 2009-08-28 02:09:06.000000 | Oklahoma | 3.5 |
| usp000h0x7 | 2009-08-27 08:22:14.530000 | Oklahoma | 3.4 |
| usp000gt6w | 2009-01-28 11:19:09.470000 | Oklahoma | 3.4 |
| usp000gurq | 2009-03-08 13:06:39.940000 | Oklahoma City urban area, Oklahoma | 3.4 |
| usp000gyu8 | 2009-07-01 17:14:48.240000 | Oklahoma | 3.4 |
| usp000gy78 | 2009-06-14 21:31:09.020000 | Oklahoma | 3.4 |
| usp000gucq | 2009-02-25 04:14:15.330000 | Oklahoma | 3.3 |
The answer
SELECT id, time, place, mag
FROM quakes
WHERE (latitude > 33.65 AND latitude < 37.51 ) AND
  (longitude > -103.25 AND longitude < -94.17) AND
  substr(time, 1, 4) = '2009'
ORDER BY mag DESC
LIMIT 10;
5. For Oklahoma, count the number of earthquakes per year
You can basically copy, and use most the same code from questions 3 and 4. Another way to think of it, aggregate the result you got from question 4.
There should only be two columns: year and a count
As a hint, the first part of the query:
SELECT STRFTIME('%Y', time) AS year,
  COUNT(*) quakecount
Looks like something is going on in Oklahoma:
| year | quakecount |
|---|---|
| 1995 | 4 |
| 1996 | 2 |
| 1997 | 3 |
| 1998 | 4 |
| 1999 | 1 |
| 2000 | 6 |
| 2002 | 4 |
| 2003 | 1 |
| 2004 | 2 |
| 2005 | 1 |
| 2006 | 5 |
| 2007 | 3 |
| 2008 | 4 |
| 2009 | 20 |
| 2010 | 42 |
| 2011 | 63 |
| 2012 | 35 |
| 2013 | 104 |
| 2014 | 628 |
| 2015 | 948 |
The answer
SELECT substr(time, 1, 4) AS year,
  COUNT(*) quakecount
FROM quakes
WHERE (latitude > 33.65 AND latitude < 37.51 ) AND
  (longitude > -103.25 AND longitude < -94.17)
GROUP BY year
ORDER BY year ASC;
6. How many earthquakes per year and month?
After doing the query, you'll have to export to a spreadsheet and create a visualization: make a time series, which is just a bar chart with time values on the x-axis – we're getting a frequency count per month.
Hint: Start by writing a query that gets time in year-month format.
For example, given:
1995-01-01 12:43:19.340000
Transform it to:
1995-01
I recommend trying out STRFTIME, as it ultimately is the best tool for time conversions. But sure, SUBSTR is straightforward.
Remember to sort by year-month.
Here's the chart:
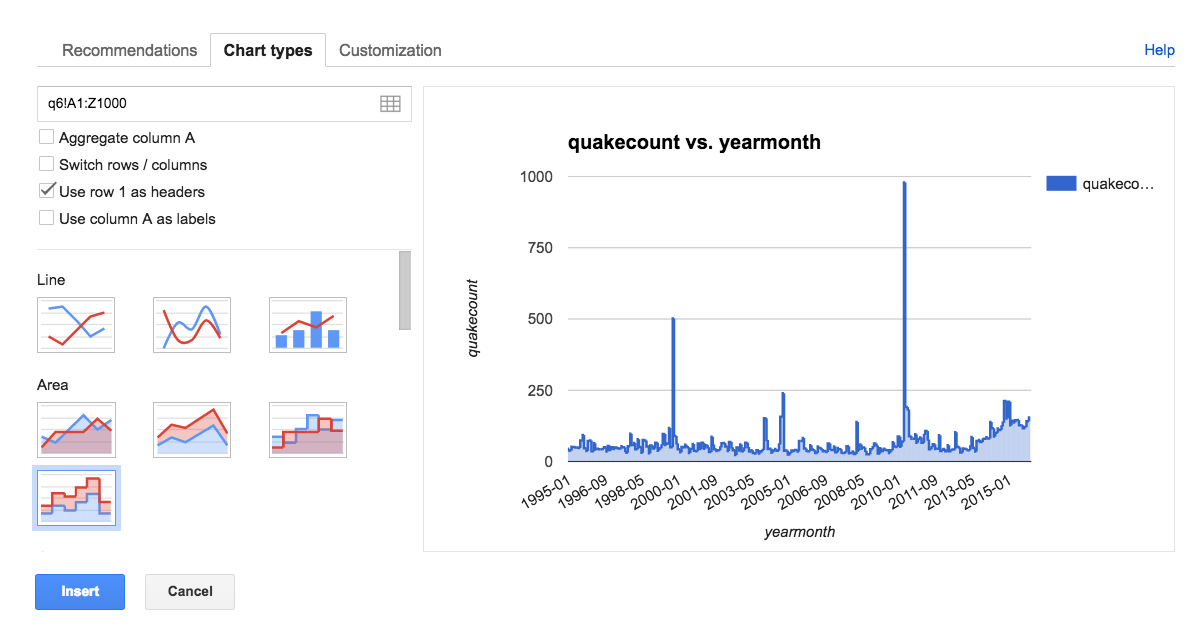
Result (just the first 20 rows of 252, think of 12 * number of years):
| yearmonth | quakecount |
|---|---|
| 1995-01 | 45 |
| 1995-02 | 39 |
| 1995-03 | 52 |
| 1995-04 | 51 |
| 1995-05 | 50 |
| 1995-06 | 49 |
| 1995-07 | 48 |
| 1995-08 | 74 |
| 1995-09 | 93 |
| 1995-10 | 47 |
| 1995-11 | 37 |
| 1995-12 | 72 |
| 1996-01 | 74 |
| 1996-02 | 36 |
| 1996-03 | 64 |
| 1996-04 | 42 |
| 1996-05 | 45 |
| 1996-06 | 43 |
| 1996-07 | 43 |
| 1996-08 | 44 |
The answer
SELECT
  STRFTIME('%Y-%m', time) AS yearmonth,
  COUNT(*) AS quakecount
FROM quakes
GROUP BY yearmonth
ORDER BY yearmonth limit 20;
7. How many earthquakes are there per tenth of magnitude measurement?
Get a count of earthquakes grouped by their mag (rounded to nearest tenth). Order the list in ascending order of the rounded mag.
Like the previous exercise, write a query, export to a spreadsheet, and visualize.
The visualization should be a histogram, which, like a time-series, is a bar chart in which the y-values are a frequency count (it's a time-series not measuring by time…).
Hence, we want to count how many earthquakes are how serious.
Same as exercise 6, just different thing to GROUP BY.
Here's what the end chart looks like:
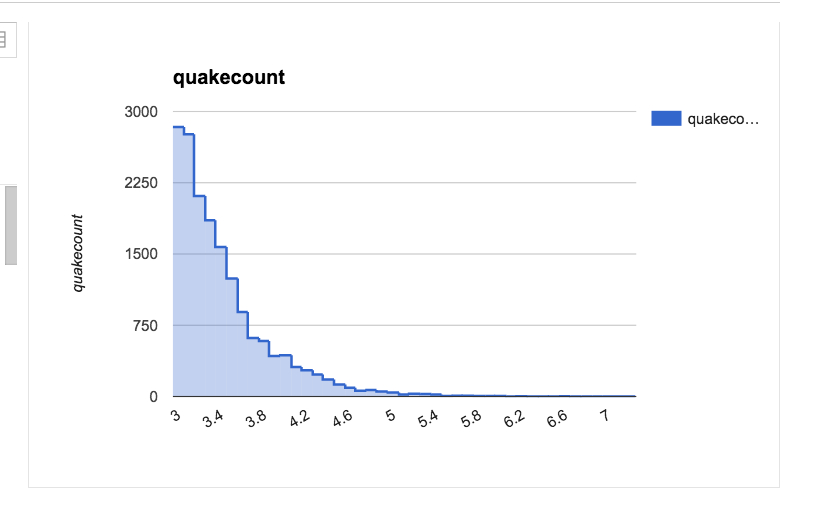
Result:
| magx | quakecount |
|---|---|
| 3.0 | 2837 |
| 3.1 | 2759 |
| 3.2 | 2109 |
| 3.3 | 1855 |
| 3.4 | 1573 |
| 3.5 | 1242 |
| 3.6 | 889 |
| 3.7 | 615 |
| 3.8 | 584 |
| 3.9 | 428 |
| 4.0 | 435 |
| 4.1 | 311 |
| 4.2 | 278 |
| 4.3 | 232 |
| 4.4 | 180 |
| 4.5 | 128 |
| 4.6 | 94 |
| 4.7 | 61 |
| 4.8 | 69 |
| 4.9 | 53 |
| 5.0 | 44 |
| 5.1 | 22 |
| 5.2 | 30 |
| 5.3 | 26 |
| 5.4 | 23 |
| 5.5 | 6 |
| 5.6 | 9 |
| 5.7 | 10 |
| 5.8 | 7 |
| 5.9 | 6 |
| 6.0 | 7 |
| 6.1 | 1 |
| 6.2 | 3 |
| 6.3 | 2 |
| 6.4 | 1 |
| 6.5 | 2 |
| 6.6 | 3 |
| 6.7 | 2 |
| 6.8 | 1 |
| 6.9 | 1 |
| 7.0 | 1 |
| 7.1 | 1 |
| 7.2 | 1 |
SELECT
  ROUND(mag, 1) as magx,
  COUNT(*) AS quakecount
FROM quakes
GROUP BY magx
ORDER BY magx;
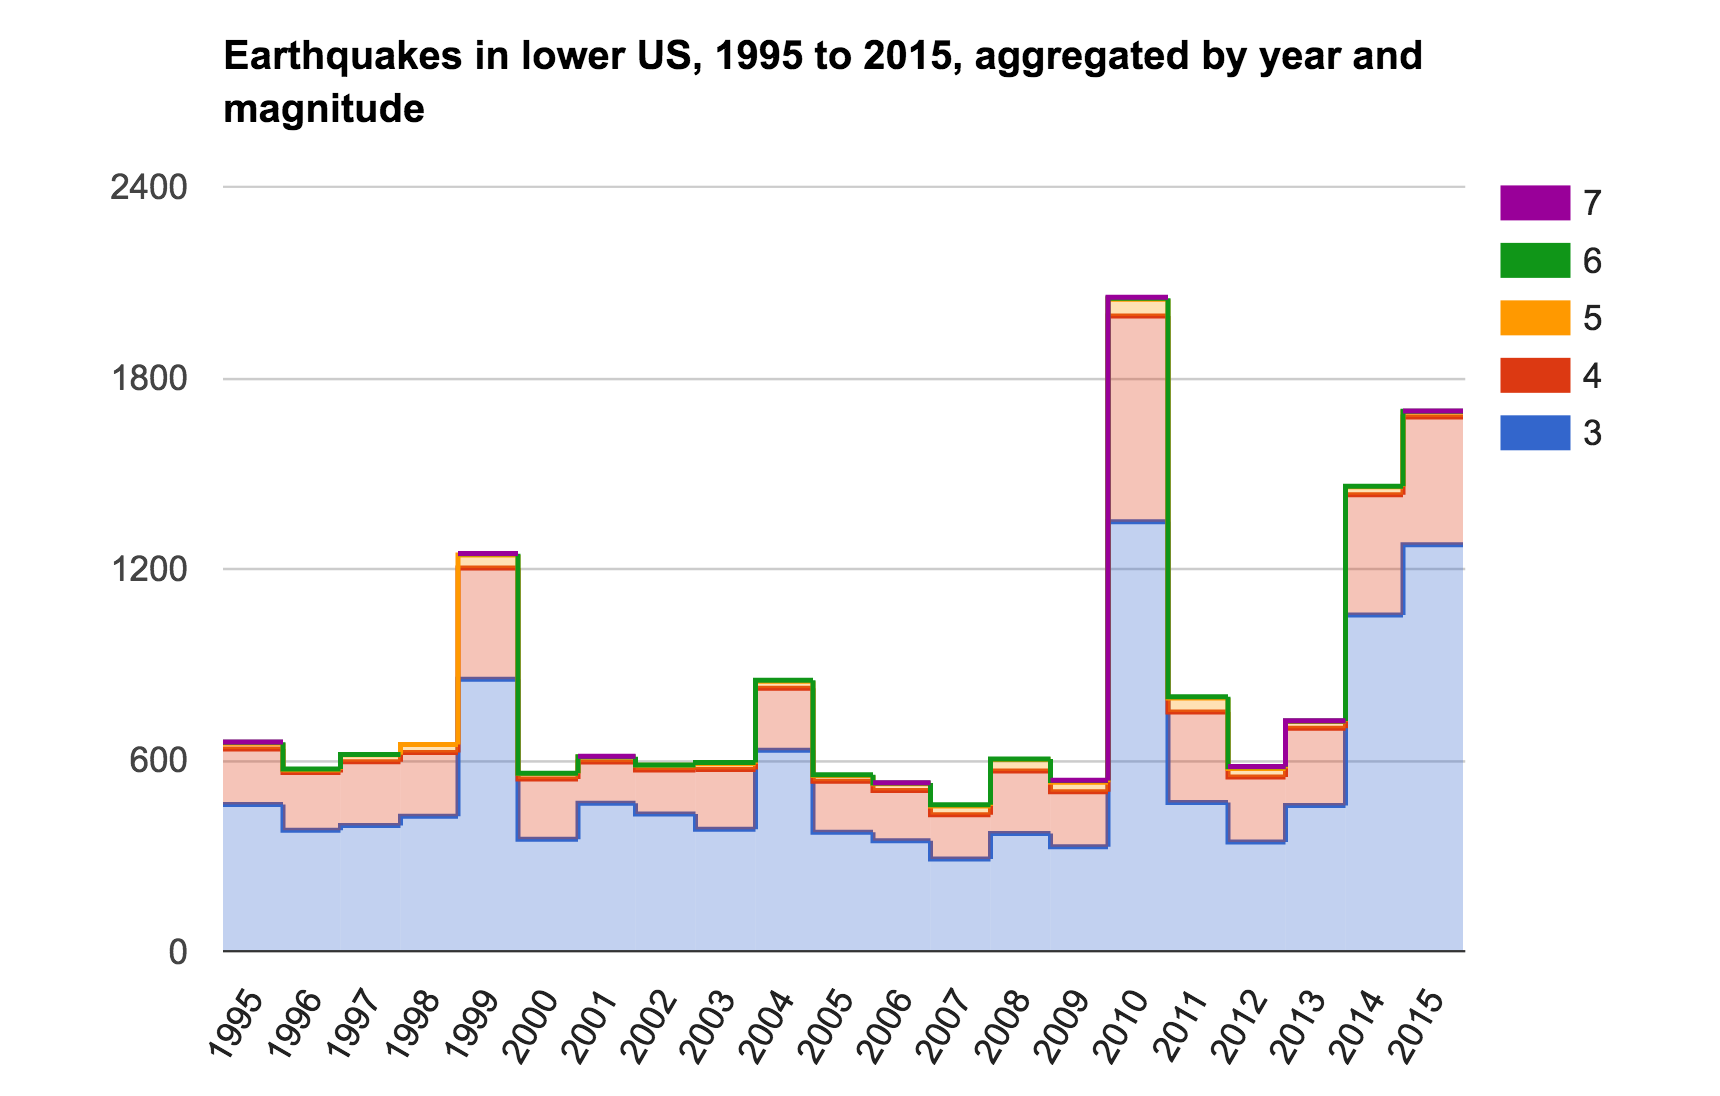
8. How many earthquakes per year and magnitude (rounded to integer)?
The query is similar to 6 and 7, but different granularity, and grouping by two things. And an example of how a pivot table is useful even after grouping with a database.
Should consist of 3 columns, for year, magnitude rounded, and count of quakes. Sort by year and magnitude, both in ascending order.
| year | magx | quakecount |
|---|---|---|
| 1995 | 3.0 | 461 |
| 1995 | 4.0 | 174 |
| 1995 | 5.0 | 18 |
| 1995 | 6.0 | 3 |
| 1995 | 7.0 | 1 |
| 1996 | 3.0 | 380 |
| 1996 | 4.0 | 181 |
Once you've queried and exported the data to a spreadsheet, you'll have to do a pivot table: magnitudes as rows, years as columns. It should look like this:
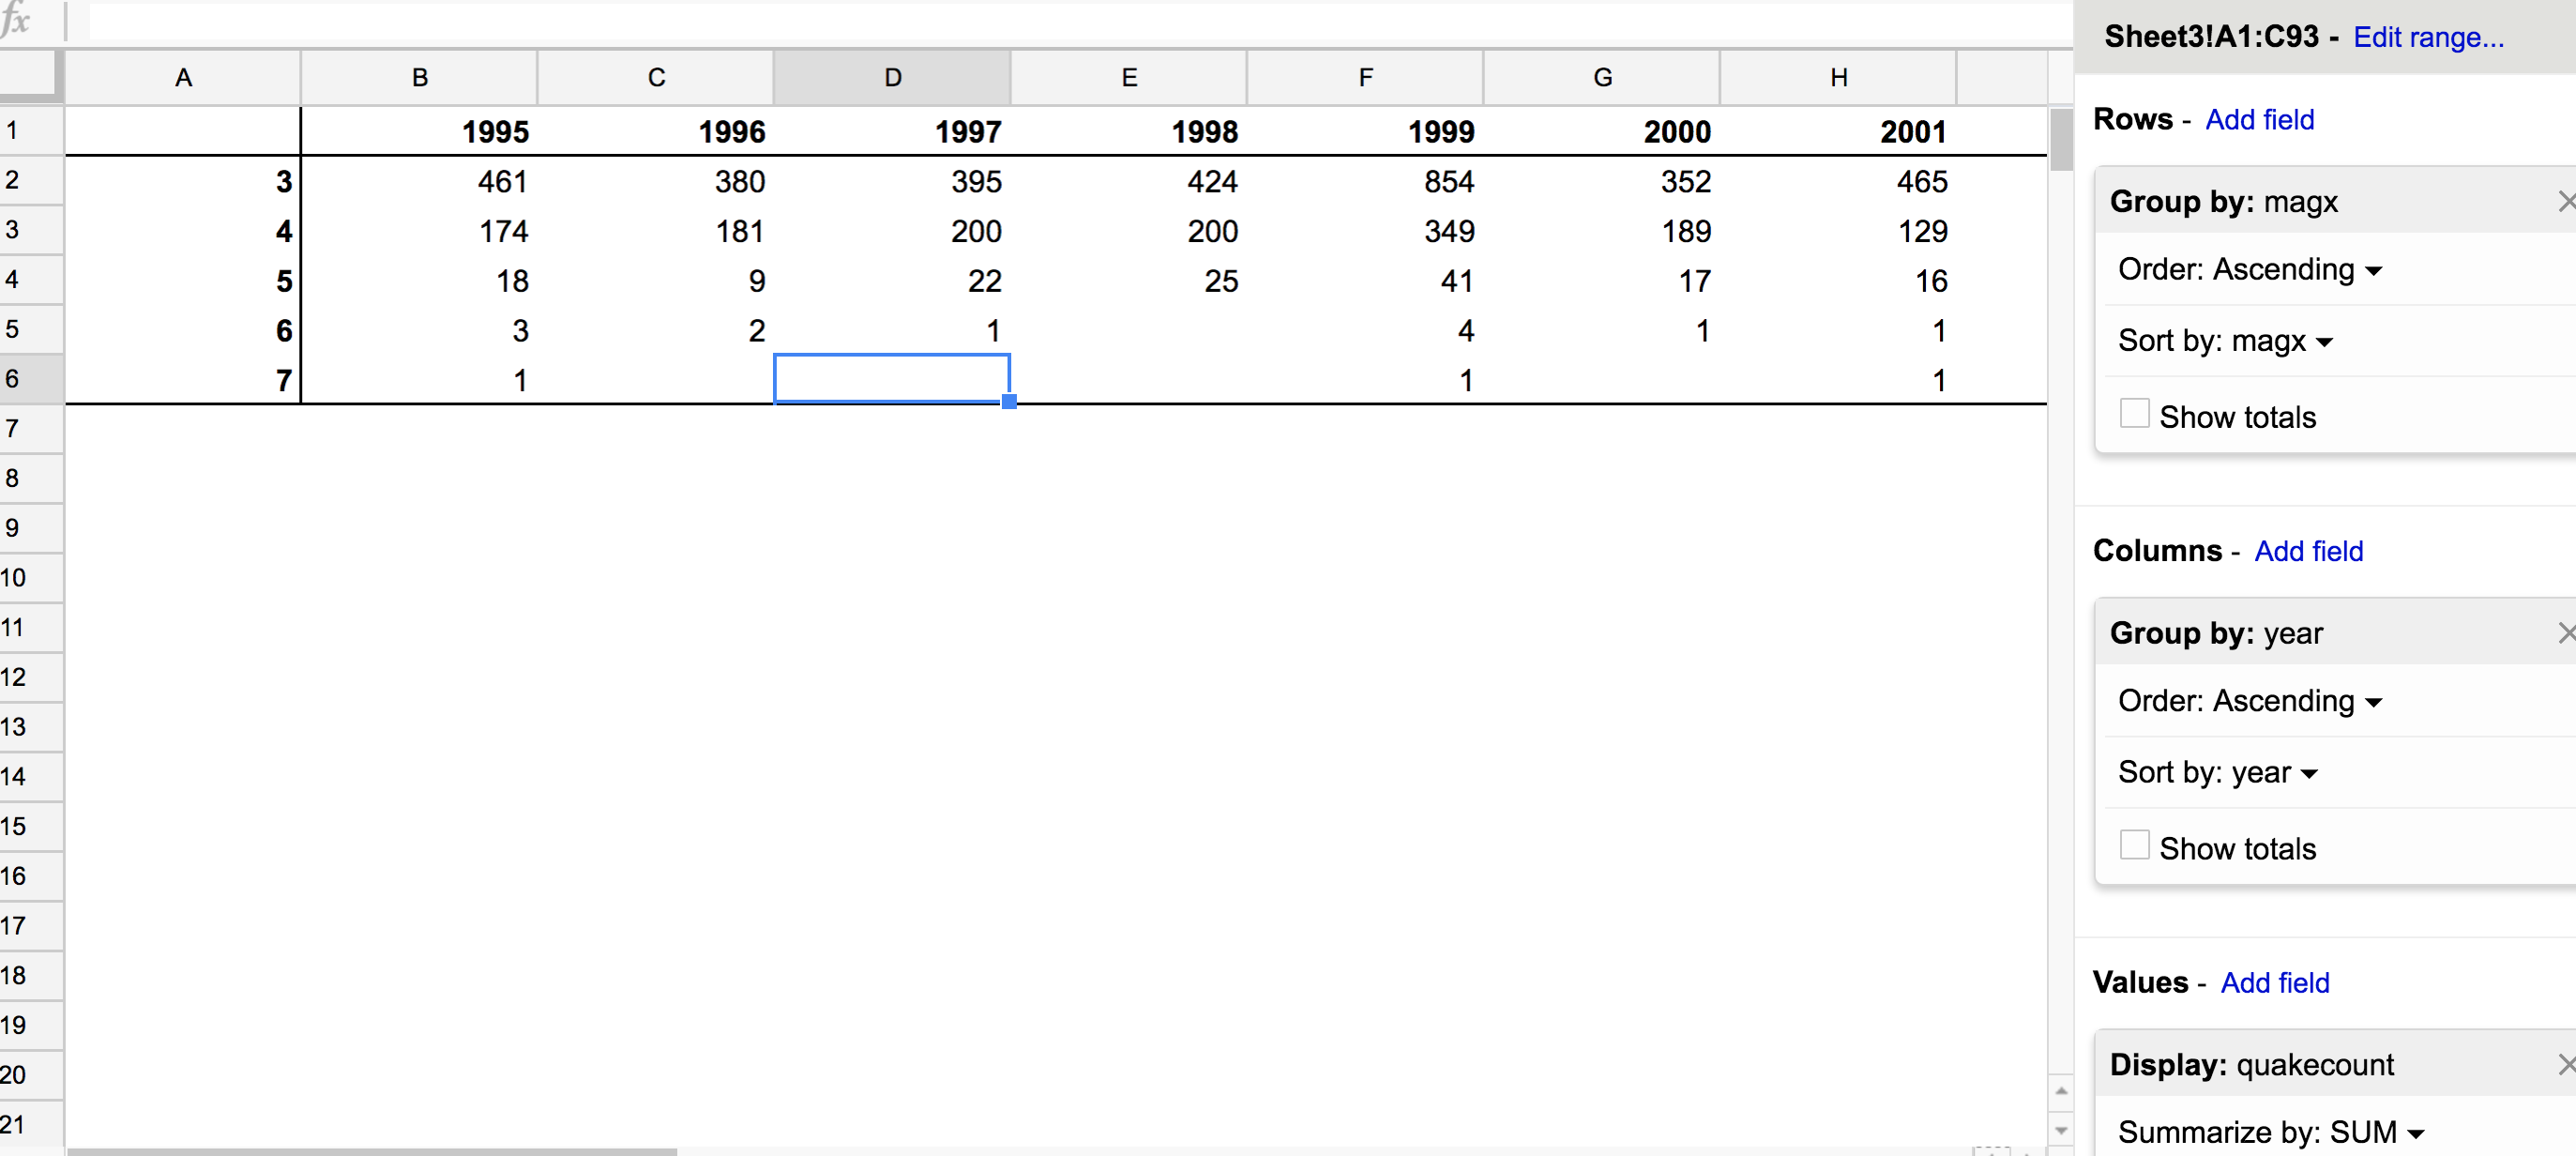
Then create a stacked bar/area chart (hint: highlight the entire pivot chart):
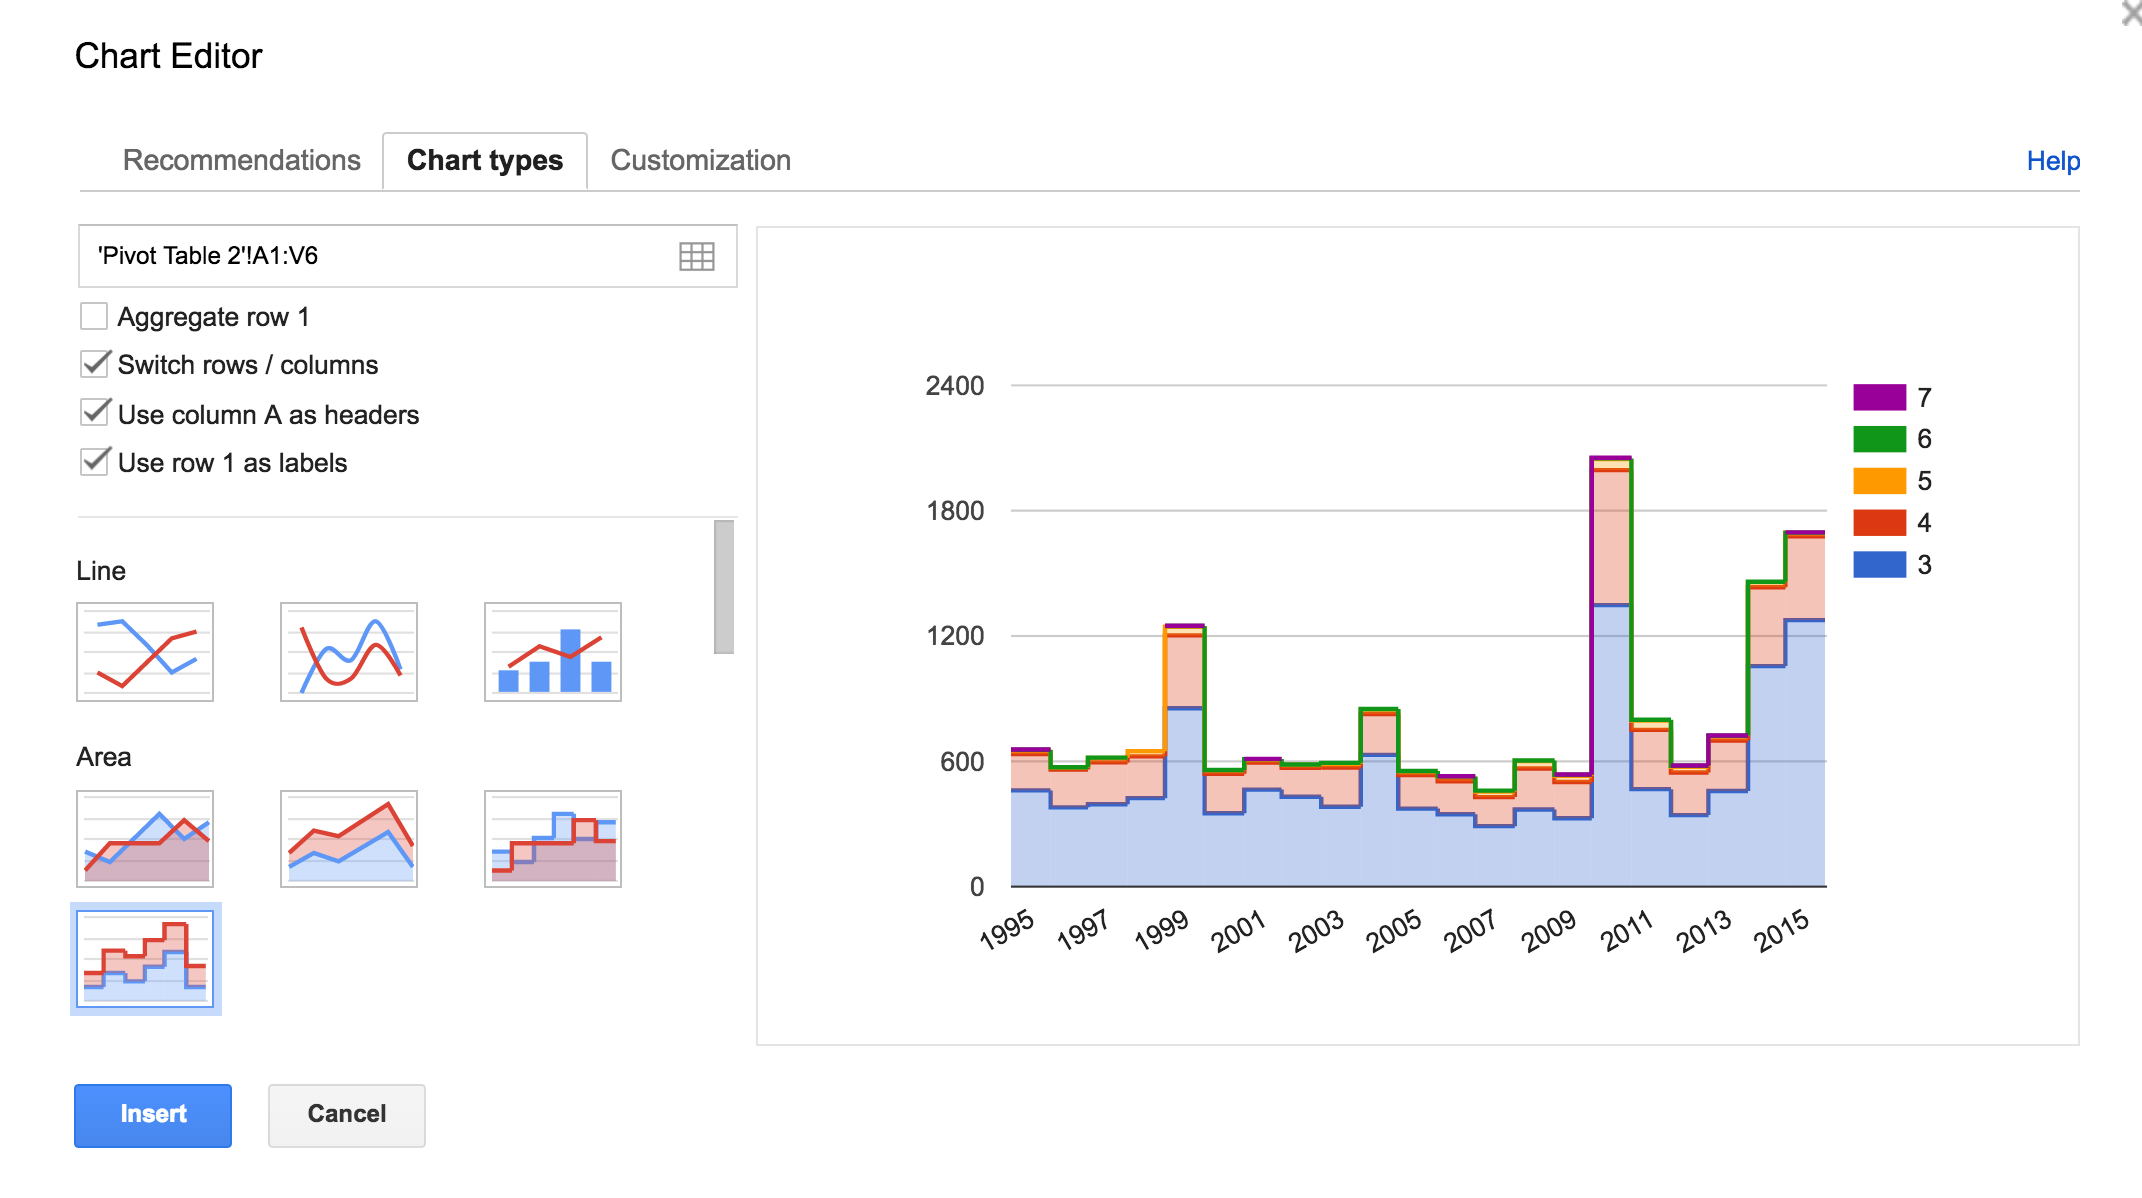
The point of that chart? Shows that there are far more quakes in the M3 to 4.0 range.
The answer.
SELECT
  STRFTIME('%Y', time) AS year,
  ROUND(mag) AS magx,
  COUNT(*) AS quakecount
FROM quakes
GROUP BY year, magx
ORDER BY year, magx;