Phillip Reese Visits
A collection of the links and tips that Phillip brought up in his talk about how he does data journalism
You can follow Phillip on Twitter at @philliphreese
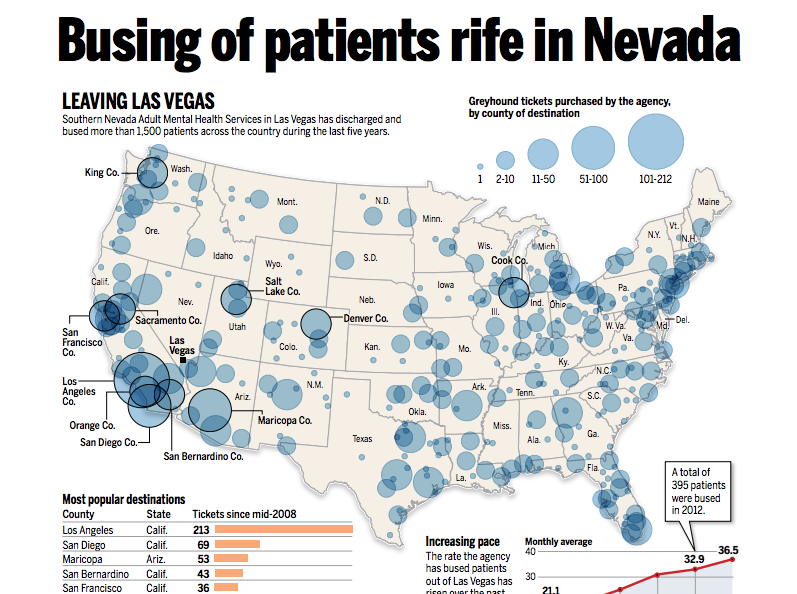
The series for which Phillip was nominated a Pulitzer finalist began with a personal portrait of a lost man, and expanded with a data map: Busing of patients rife in Nevada. The dots on the map are where patients were bused. How did Phillip get those locations? By hand-entering receipts into a spreadsheet. Having structured data, even just a spreadsheet, is the difference between a powerful visual and a bunch of scattered papers.
The Bee's Data Tracker Database is a nice landing page of Phillip's work (along with other Bee data journalists). Notice that not everything has to be some dramatic thing, just sparking curiosity is valuable.
A few Phillip tips
- He was just a normal crime reporter in Greensboro, N.C. He got into data after wondering why he should just take the sheriff's word about the current crime stats.
- Census data is one of his frequent data sources when writing data stories. Phillip says he likes using FactFinder.
- Phillip says he uses the Page Monitor plugin to track a list of 600 government pages that he's gotten news from in the past. Keep in mind that the plugin alone is not useful; you need a list of sites that you're interested in. But finding stories doesn't require some kind of revolutionary concept; if you're not manually checking 600 pages a day to scan for updates, that's a huge amount of time you're saving.
- Note that the creator of Page Monitor apparently is focusing on a new similar plugin called VisualPing. Seems to be well-reviewed…
Stories that Phillip discussed
Sacramento sheriff revokes dozens of concealed carry permits following arrests, gun crimes - Sparked by the fact that the sheriff is issuing permits at a far greater rate.
Amid mass shootings, gun sales surge in California - Paying attention to the news can be enough. When something happens, ask what might be affected.
Dog bites man – and a lot more often than he used to - This data doesn't seem complicated, but look at the kind of things that Phillip focuses on to make this data interesting.
Roughly 5 million people left California in the last decade. See where they went - I would've guessed this data comes from the Census, but it's the IRS. What else might they track besides tax-specific data?
The achievement gap grew starkly under California's new Common Core tests. See it in your community. - when new data comes out, immediately ask, "What's changed?" Start with the boilerplate numbers (state average, overall). Then repeat that calculation across different populations and groups.
Longing for justice - Phillip didn't bring this up but I posted it as a link to read. One of many examples of where Phillip combines data analysis with old-fashioned reporting. He didn't report this from his desk but went to their doorstep. Data analysis doesn't have to be much more sophisticated than listing what you think is overlooked, and then following it up with regular reporting.